Patterns are a language for describing what buyers and sellers are doing. The names matter less than the logic: who is losing control, who is gaining it, and where the market is proven wrong.
The cheat sheet
| Pattern | Type | Bias | Trigger | Typical target |
|---|---|---|---|---|
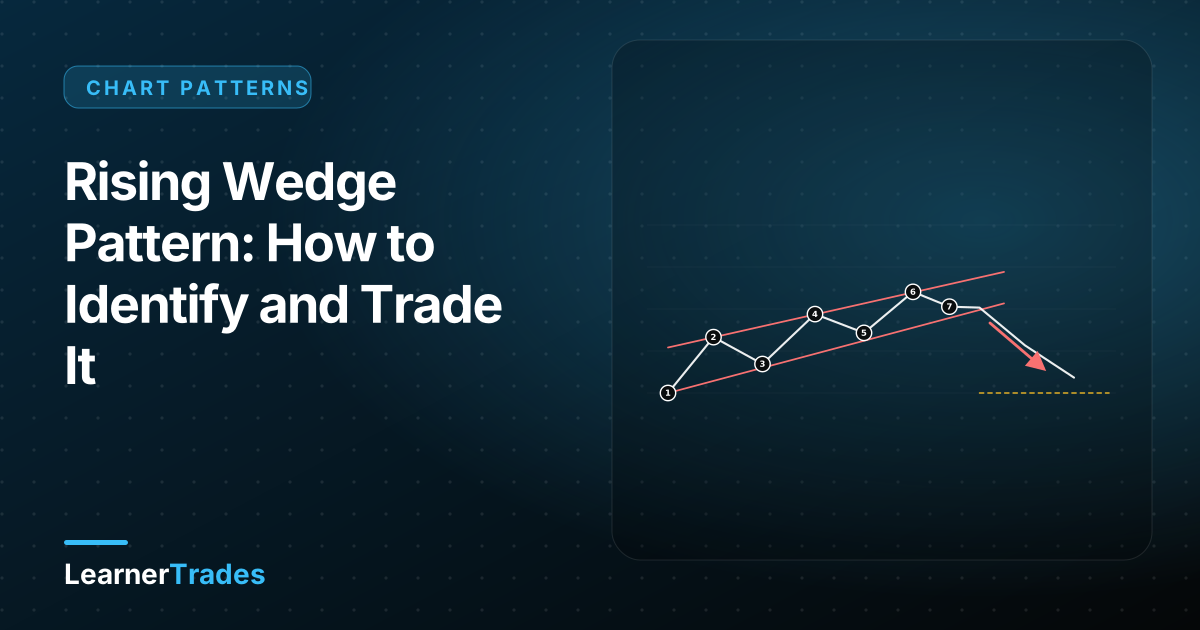
| Rising wedge | Reversal (or continuation in a downtrend) | Bearish | Close below the lower line | Start of the wedge |
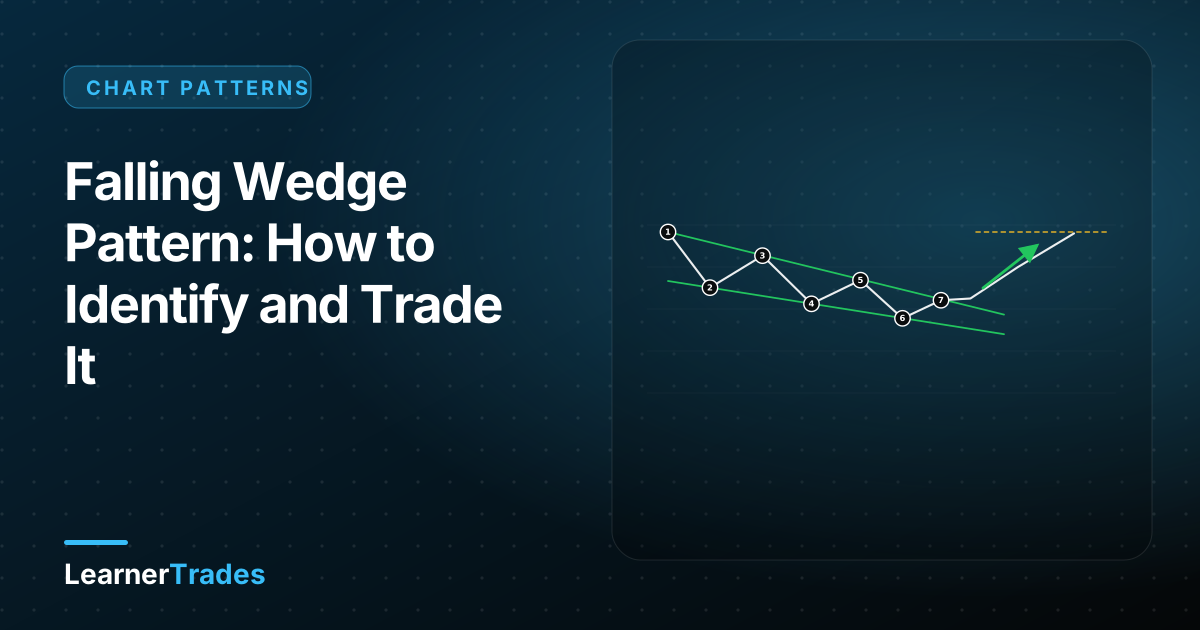
| Falling wedge | Reversal (or continuation in an uptrend) | Bullish | Close above the upper line | Start of the wedge |
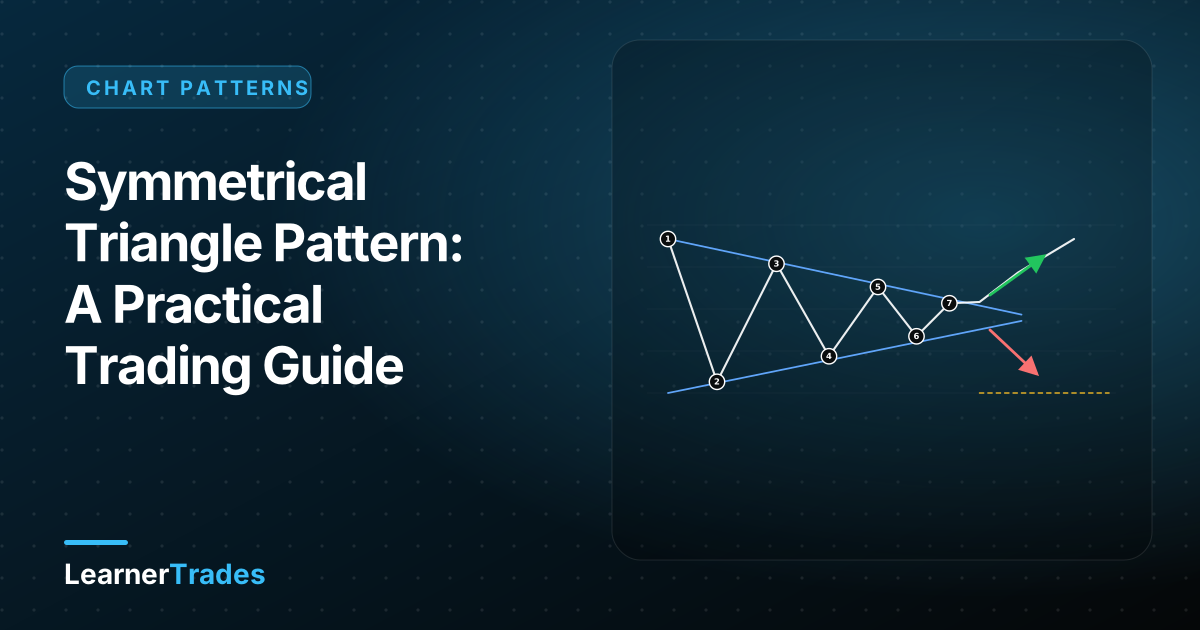
| Symmetrical triangle | Continuation (neutral) | Either | Closing break of either line | Height of the triangle |
| Ascending triangle | Continuation | Bullish | Close above flat resistance | Height of the triangle |
| Descending triangle | Continuation | Bearish | Close below flat support | Height of the triangle |
| Head and shoulders | Reversal | Bearish | Close below the neckline | Head-to-neckline distance |
| Inverse head and shoulders | Reversal | Bullish | Close above the neckline | Head-to-neckline distance |
| Double top | Reversal | Bearish | Close below the neckline | Pattern height |
| Double bottom | Reversal | Bullish | Close above the neckline | Pattern height |
| Bull / bear flag | Continuation | With the pole | Close beyond the flag | Pole length |
| Cup and handle | Continuation | Bullish | Close above the rim | Cup depth |
| Rectangle | Continuation (neutral) | Either | Closing break of either side | Range height |
Reversal patterns
Reversal patterns need a trend to reverse. Their trigger is almost always a neckline break. See the detailed guides on head and shoulders and double tops and bottoms.
Continuation patterns
Continuation patterns are pauses inside a trend. They are generally traded with the trend after a breakout. Read more on flags, triangles and cup and handle.
Wedges: bias against the slope
Wedges slope one way and usually break the other, because the slope is weakening momentum. See rising wedge and falling wedge.
One process for every pattern
- Trend first. What is the bigger picture on a higher timeframe?
- Identify the structure with clear touches on each line.
- Wait for a closing break. No close, no trade.
- Place the stop beyond the pattern and size the position from it, see risk management.
- Check risk-to-reward is at least 1:2 to the first realistic target.
- Record the result in your journal, win or lose.
Related guides
- Market structure explained
- How to read candlestick charts
- How to write a trade plan
- Risk management and position sizing
Frequently asked questions
What is the difference between reversal and continuation patterns?
Reversal patterns signal that the prevailing trend may be ending (for example head and shoulders). Continuation patterns signal a pause before the trend resumes (for example flags).
Which chart pattern is the most reliable?
No pattern is consistently reliable on its own. Reliability improves with a clear prior trend, a higher timeframe, a closing break, volume confirmation and sensible risk-reward.
Do I need indicators to trade patterns?
No. Price is enough. Indicators such as RSI divergence or volume can help confirm, but they are optional.