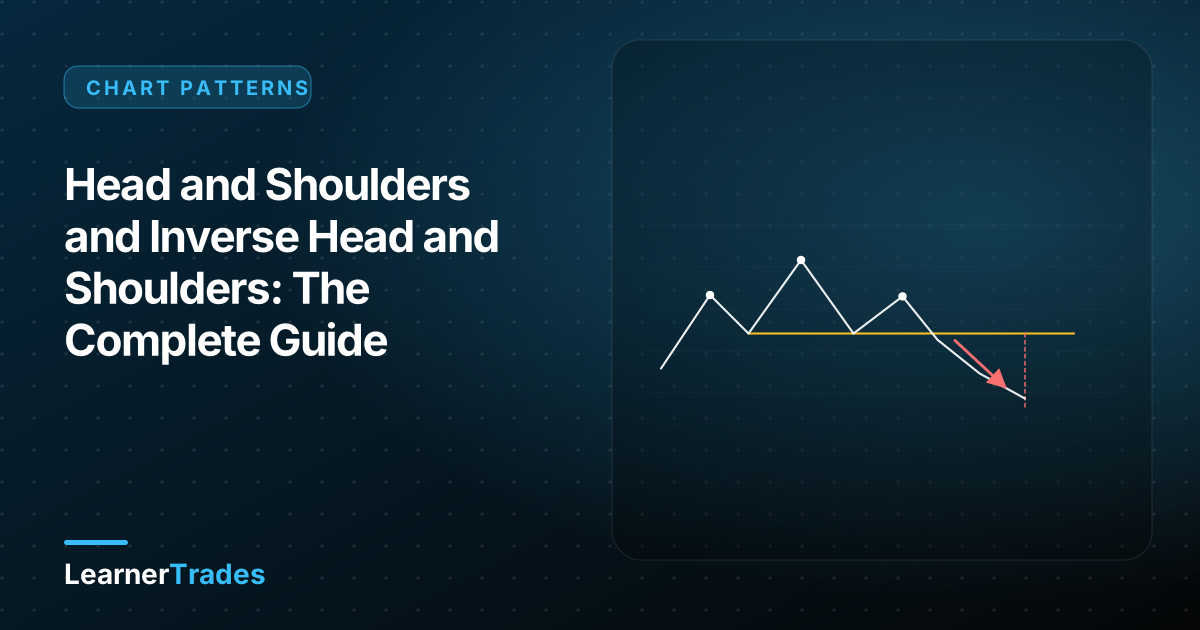
The head and shoulders tells a clear story: an uptrend makes a final, higher push (the head), then fails to repeat it (the right shoulder). The market has run out of buyers.
Anatomy of a head and shoulders (bearish)
- Left shoulder: a rally to a high, followed by a pullback.
- Head: a rally to a higher high, followed by a pullback to roughly the same level as the first pullback.
- Right shoulder: a rally that fails below the head, then a decline.
- Neckline: the line through the two troughs. A close below it completes the pattern.
How to trade it
- Entry: a candle close below the neckline. Many traders prefer waiting for a retest of the neckline from below that fails.
- Stop-loss: above the right shoulder (tighter) or above the head (safer).
- Target: measure from the top of the head to the neckline, and project that distance down from the breakout.
- Volume clue: volume is often highest on the left shoulder and head, lower on the right shoulder, and rises on the break.
Inverse head and shoulders (bullish)
The same pattern upside down, forming after a downtrend. Three troughs with the middle one lowest, and a neckline across the two peaks. A close above the neckline signals a potential trend change; the head-to-neckline distance, projected up, is the usual target.
What makes it more reliable
- A clear prior trend to reverse (the pattern needs something to end).
- Symmetry is a bonus, not a requirement. Real shoulders are rarely equal.
- Higher timeframes (H4, daily) give more meaningful patterns.
- A close and a retest rather than a wick through the neckline.
Common mistakes
- Calling the pattern before the right shoulder forms.
- Shorting the right shoulder peak with no break of the neckline.
- Ignoring the invalidation: a move back above the right shoulder means the idea is wrong.
Related guides
- Double top and double bottom
- Chart patterns cheat sheet
- Market structure explained
- Risk management and position sizing
Frequently asked questions
How reliable is the head and shoulders pattern?
It is one of the best-known reversal patterns, but no pattern is guaranteed. It works best after a clear trend, on higher timeframes, and when the neckline break is confirmed by a close and a failed retest.
Does the neckline have to be flat?
No. Necklines often slope. A sloping neckline is fine, but a steeply sloping one can make the pattern less clean.
What if price breaks the neckline and returns?
A retest of the neckline from the other side is common and often provides a lower-risk entry. If price closes back through the neckline decisively, the pattern has failed and you should exit.