Every price chart, on every timeframe, is just a sequence of swings. Price pushes up, pauses, pulls back, then either continues or fails. Market structure is the discipline of reading those swings so you know who is in control and where control could change hands. It is the foundation under every other technique — support and resistance, supply and demand, patterns, even indicators — and it is the first thing we check before publishing a signal.
Swing highs and swing lows
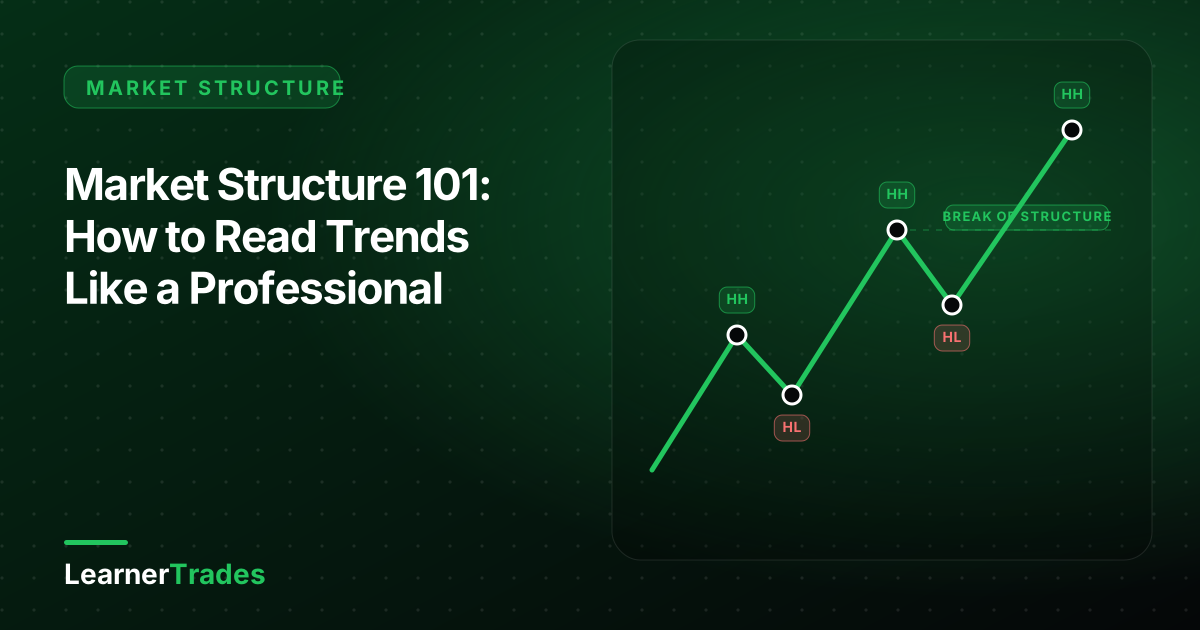
A swing high is a candle whose high is higher than the highs on both sides of it. A swing low is the mirror image. Those points are where buyers or sellers were briefly exhausted. Join them up and you get the skeleton of the market:
- Uptrend: higher highs (HH) and higher lows (HL). Buyers are willing to pay more on each pullback.
- Downtrend: lower highs (LH) and lower lows (LL). Sellers are willing to sell at worse prices on each bounce.
- Range: highs and lows roughly equal. Nobody is in control; the market is building energy.
The most important swing in an uptrend is the last higher low that produced the most recent higher high. As long as price holds above it, the trend is intact. The moment price closes below it, the uptrend is damaged.
Break of structure vs. change of character
Two events matter:
- Break of structure (BOS): price closes beyond the previous swing in the direction of the trend. In an uptrend, a close above the last HH is a BOS. It tells you the trend is still working and the pullback that preceded it was healthy.
- Change of character (CHoCH): price closes beyond the last protected swing against the trend. In an uptrend, a close below the last HL is a CHoCH. It does not guarantee a reversal, but it tells you the one-sided market has ended and you should stop buying pullbacks blindly.
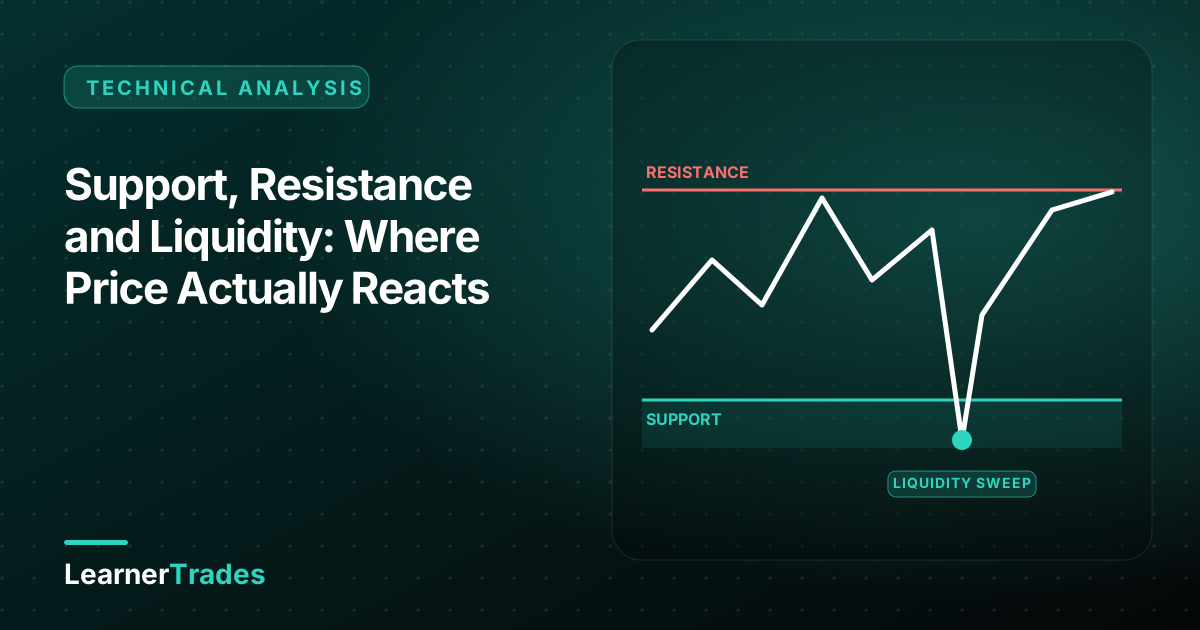
Novices get this wrong in a specific way: they treat every wick through a level as a break. Wicks are often liquidity sweeps — a quick push through obvious stops before price snaps back. We require a candle close on the timeframe we are reading before we accept a break, and ideally a retest that holds.
Top-down alignment
Structure exists on every timeframe simultaneously, and they frequently disagree. The 5-minute chart may be in a downtrend while the daily chart is in a strong uptrend. That is not a contradiction; it is a pullback.
Our process:
- Daily / 4-hour: define the bias. Are we making HH/HL or LH/LL? Where is the last protected swing?
- 1-hour: find where the pullback is likely to end — a prior demand zone, the 50–61.8% retracement of the last impulse, a previous BOS level.
- 15-minute: wait for the lower timeframe to print its own CHoCH in the direction of the higher-timeframe bias. That is the entry trigger.
If the timeframes do not line up, there is no trade. Most of the losing trades in any retail account are counter-trend trades taken because a lower timeframe "looked bullish".
Impulse and correction
Trends move in two phases. Impulse legs are fast, with large candles and little overlap — this is where institutional order flow is dominant. Corrective legs are slow, overlapping and choppy — this is where the market absorbs orders and rebuilds. You want to be entering near the end of corrections and holding through impulses. If your entries keep getting stopped out, check whether you are buying into the middle of a correction instead of its end.
A useful tell: corrections that lose momentum (smaller candles, lower volume, failure to make progress) are more likely to resolve in the direction of the prior impulse.
Where the stop belongs
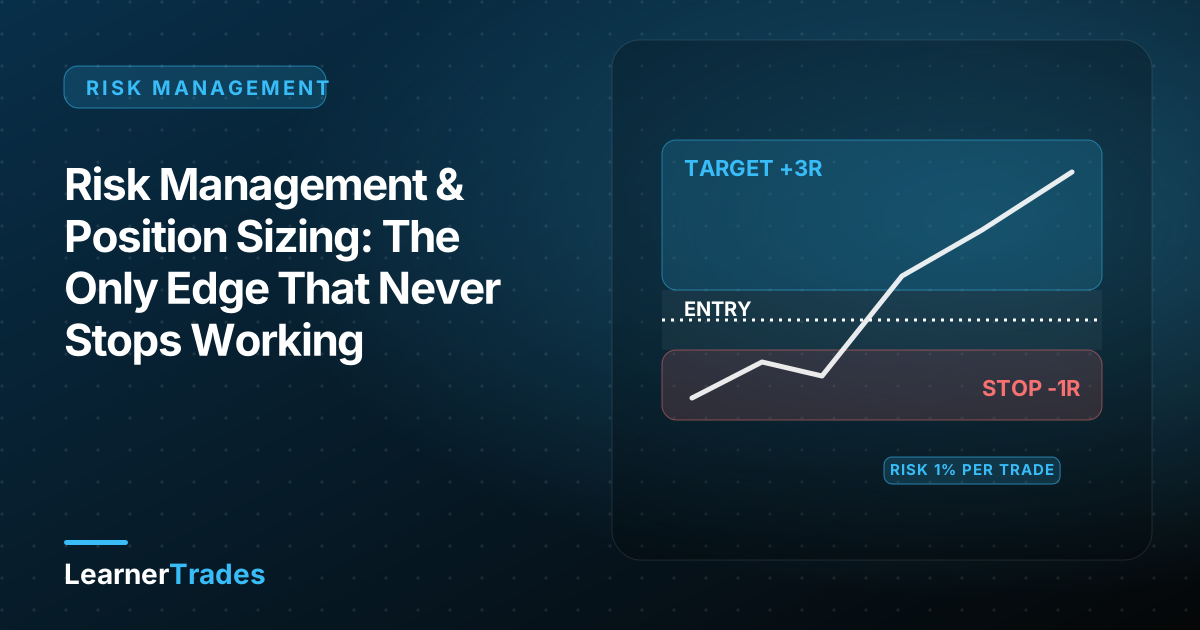
Structure gives you an objective stop-loss. For a long entry, the stop belongs below the swing low that must hold for the idea to be valid, not at an arbitrary number of pips. If the stop is too far for your risk model, reduce position size — never move the stop closer to make the trade "fit". A stop that is inside the noise of the structure will be hit by normal fluctuation and tell you nothing.
A worked example
EUR/USD on the daily chart prints HH at 1.0950 and HL at 1.0810, then rallies to 1.1000 (new HH). The pullback from 1.1000 drops to 1.0870 and stalls at a prior 4-hour demand zone. On the 15-minute chart, price makes a sequence of LH/LL during the pullback, then closes above the last 15-minute lower high — a lower-timeframe CHoCH aligned with the daily uptrend. Entry on the retest of that broken level, stop below 1.0850 (below the 15-minute swing low and the demand zone), targets at 1.0950 and 1.1000. Reward-to-risk on the first target is roughly 2.5:1.
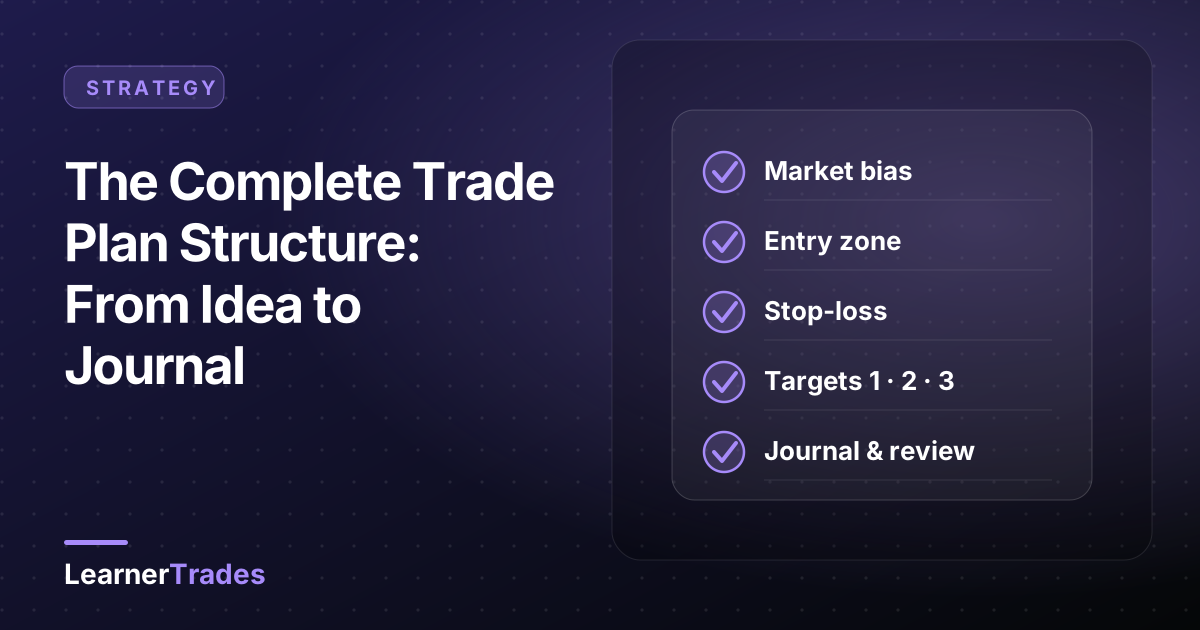
That is the complete skeleton of a structure-based trade: bias, location, trigger, invalidation, targets. Everything else is refinement.
Related guides
- Support, resistance and liquidity
- Chart patterns cheat sheet
- How to write a trade plan
- Forex trading for beginners
Frequently asked questions
What is market structure in trading?
Market structure is the sequence of swing highs and swing lows that price prints over time. An uptrend makes higher highs and higher lows; a downtrend makes lower highs and lower lows. Reading structure tells you who is in control and where that control could change.
What is a break of structure (BOS)?
A break of structure happens when price closes beyond the most recent significant swing point in the direction of the trend, confirming continuation. A break against the trend that closes beyond the last protected swing is a change of character and may signal a reversal.
Which timeframe should I use to read structure?
Read structure top-down: define the bias on a higher timeframe such as the daily or 4-hour chart, then look for entries on a lower timeframe that agree with that bias. Trading against the higher timeframe is where most losses come from.