Triangles with a flat side are among the cleanest patterns because the flat line is a clear, tested level. Buyers or sellers keep hitting it, and eventually it gives way.
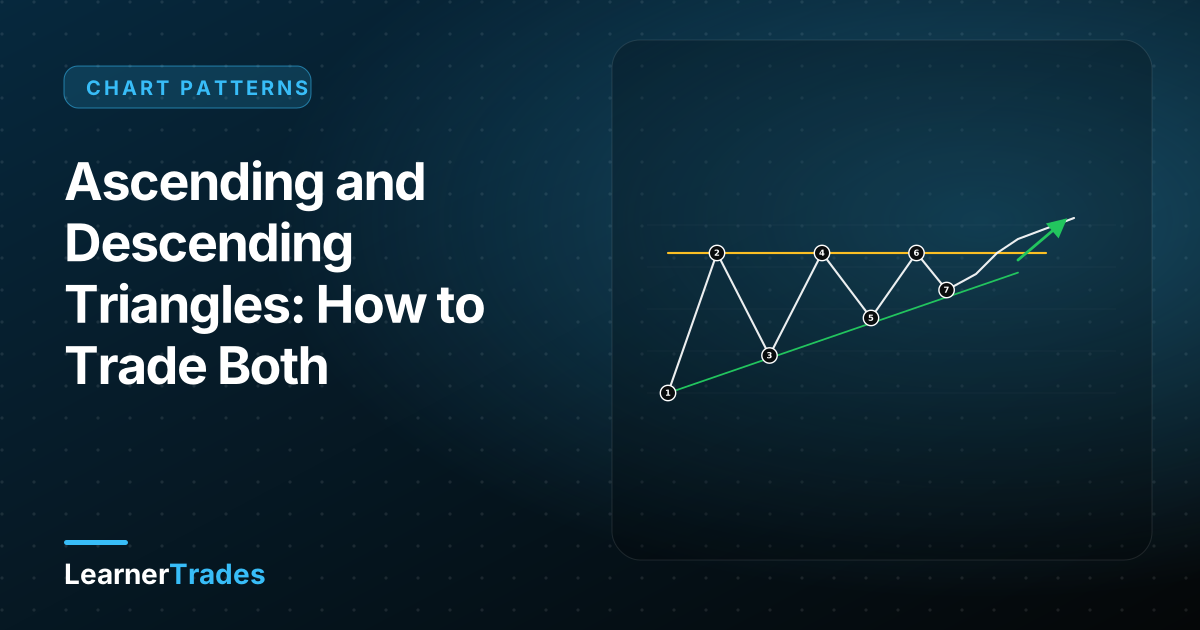
Ascending triangle (bullish lean)
Price tests a flat resistance repeatedly while making higher lows. Buyers are stepping in earlier each time, and sellers are defending one price. Each retest weakens that ceiling.
Trade plan:
- Entry: a candle close above the flat resistance, or a retest of it as support.
- Stop: below the most recent higher low (or below the rising trendline).
- Target: project the triangle's height (distance from the first low to the resistance) up from the breakout.
Descending triangle (bearish lean)
Price tests a flat support repeatedly while making lower highs. Sellers are stepping in earlier, and buyers are defending one price. Each retest weakens that floor.
Trade plan:
- Entry: a candle close below the flat support, or a failed retest of it from below.
- Stop: above the most recent lower high (or above the falling trendline).
- Target: project the triangle's height down from the breakdown.
Making them more reliable
- Count the touches. Two on each line is the minimum; three or more on the flat line is better.
- Check the trend. An ascending triangle inside an uptrend (continuation) is stronger than one at the end of a downtrend.
- Look at volume. Contracting volume inside, expansion on the break.
- Mind the nearby levels. A major resistance just above the breakout shortens your realistic target.
Common mistakes
- Trading the pattern before it breaks.
- Treating a wick through the flat line as a breakout.
- Stops placed exactly at the obvious level, where stop-hunts happen. Give the stop some room.
Related guides
- Symmetrical triangle pattern
- Chart patterns cheat sheet
- Support, resistance and liquidity
- Risk management and position sizing
Frequently asked questions
Which way does an ascending triangle usually break?
It leans bullish: a flat resistance with rising support suggests buyers are getting more aggressive. It can fail, so wait for a close above resistance.
Do triangles work on all timeframes?
Yes, the structure appears on all timeframes, but patterns on higher timeframes (H4, daily) carry more weight and produce fewer false signals than on very short timeframes.
What volume pattern do you want to see?
Volume usually contracts as the triangle forms and expands on the breakout. A breakout on weak volume is more likely to fail.