A candlestick is a compact way of showing everything that happened to price in one period (a minute, an hour, a day). Once you can read them, a chart stops being a wall of bars and starts telling a story.
Anatomy of a candle
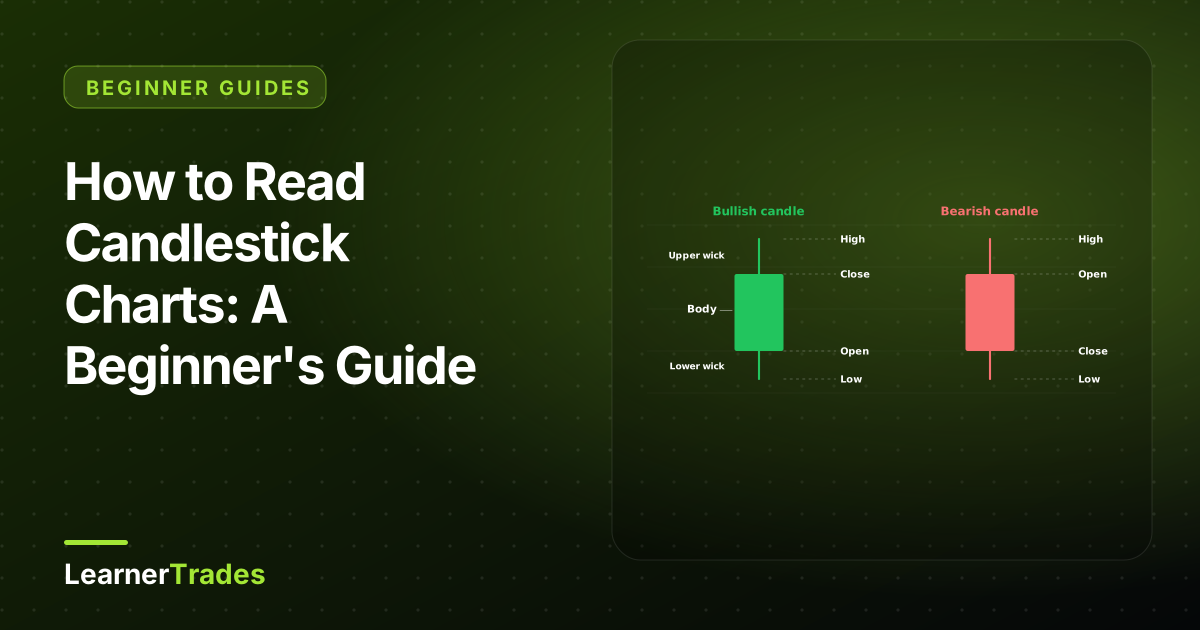
Each candle has four prices:
- Open: where the period started.
- High: the highest price reached.
- Low: the lowest price reached.
- Close: where the period ended.
The body is the thick part between open and close. The thin lines above and below are the wicks (or shadows).
What the shape tells you
- A big body means strong, one-sided pressure: buyers (green) or sellers (red) dominated.
- A small body means indecision.
- A long upper wick means price pushed up but was rejected by sellers.
- A long lower wick means price pushed down but was rejected by buyers.
Four signals to know
- Hammer: a small body at the top with a long lower wick, after a decline. Buyers rejected lower prices. More meaningful at support.
- Shooting star: a small body at the bottom with a long upper wick, after a rise. Sellers rejected higher prices. More meaningful at resistance.
- Bullish engulfing: a large green candle whose body fully covers the previous red candle. Buying has overwhelmed selling.
- Doji: open and close almost the same. It signals indecision; wait for the next candle to see who wins.
How to use them properly
- Context first. A signal in the middle of nowhere means little. Look for candles at support and resistance.
- Wait for the close. A candle is not final until the period ends. A wick can look like a hammer and then close as something else.
- Combine with structure. Use candles to time entries inside a trend you have already identified with market structure.
- Always define a stop. A candle pattern is not a guarantee. Place the stop beyond the candle's extreme.
Related guides
- Forex trading for beginners
- Chart patterns cheat sheet
- Support, resistance and liquidity
- Market structure explained
Frequently asked questions
What does the colour of a candle mean?
Usually green (or hollow) means the price closed higher than it opened, and red (or filled) means it closed lower. Colours can be customised, so check your platform.
What timeframe should beginners use?
Start with the H4 or daily chart. They produce cleaner structure and slower decisions, and are less noisy than one-minute or five-minute charts.
Are candlestick patterns reliable on their own?
Not on their own. A candle signal matters most when it forms at a meaningful level (support or resistance) and in line with the broader trend.