Rising Wedge Pattern: How to Identify and Trade It
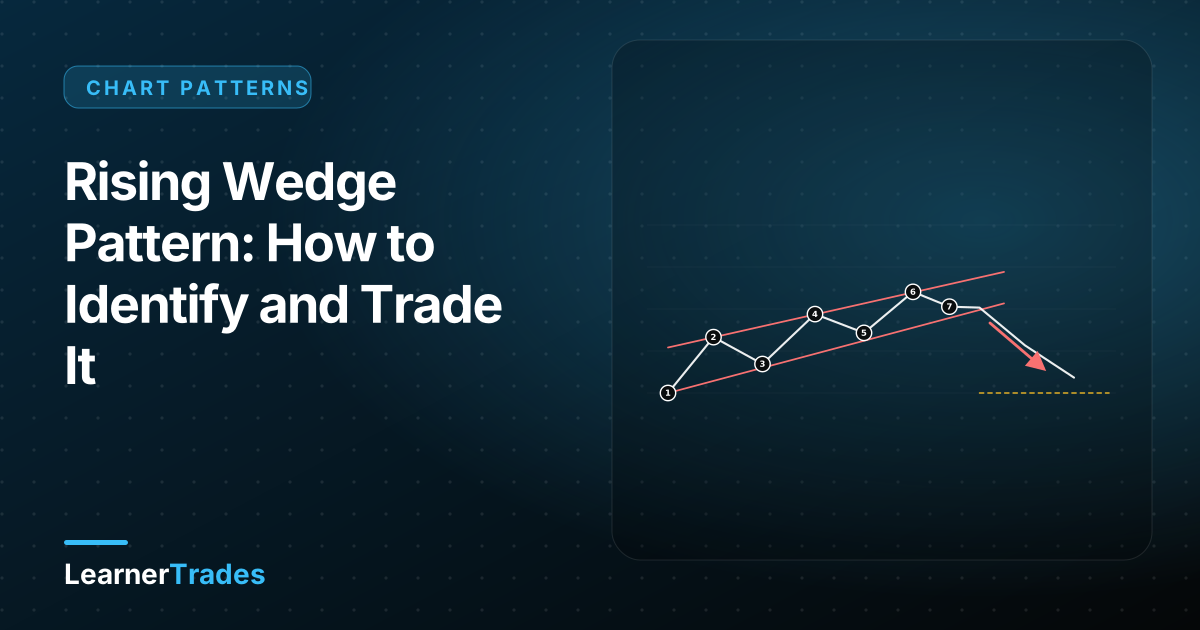
The rising wedge looks bullish but often ends in a drop. Learn how to spot it, what confirms the breakdown, where to place the stop and how to project a target.

Learn to read and trade the classic chart patterns: wedges, triangles, head and shoulders, double tops and bottoms, flags and cup and handle. Every guide has a labelled diagram and clear entry, stop and target rules.
The rising wedge looks bullish but often ends in a drop. Learn how to spot it, what confirms the breakdown, where to place the stop and how to project a target.
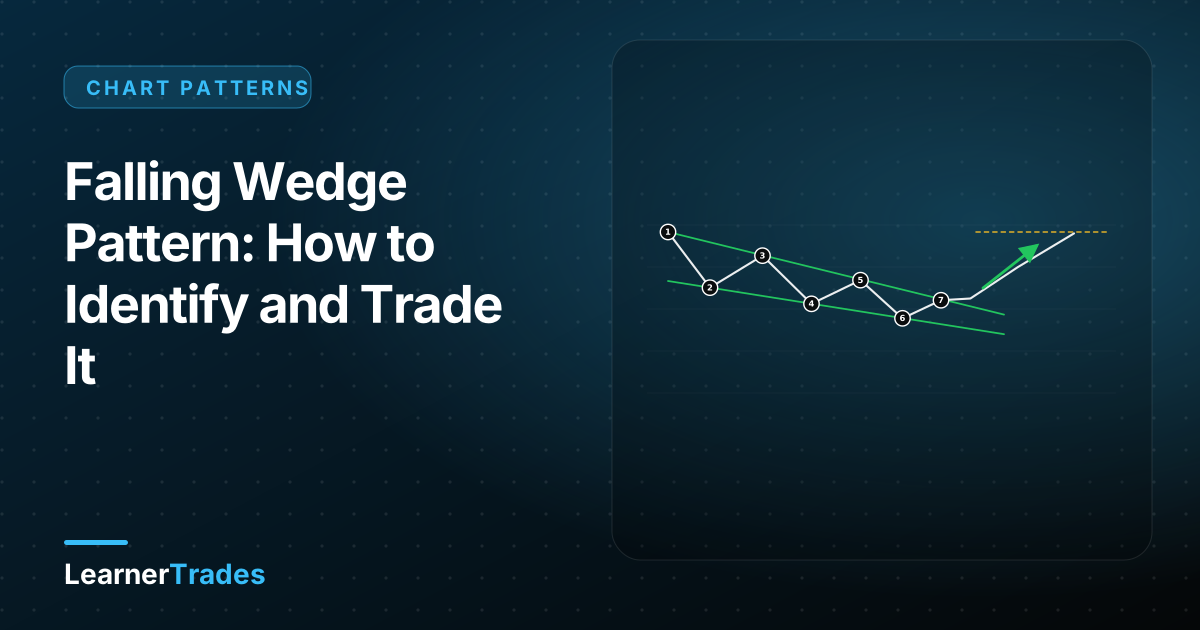
The falling wedge looks bearish but often marks the end of a selloff. Learn how to identify it, confirm the breakout, set the stop and project a target.
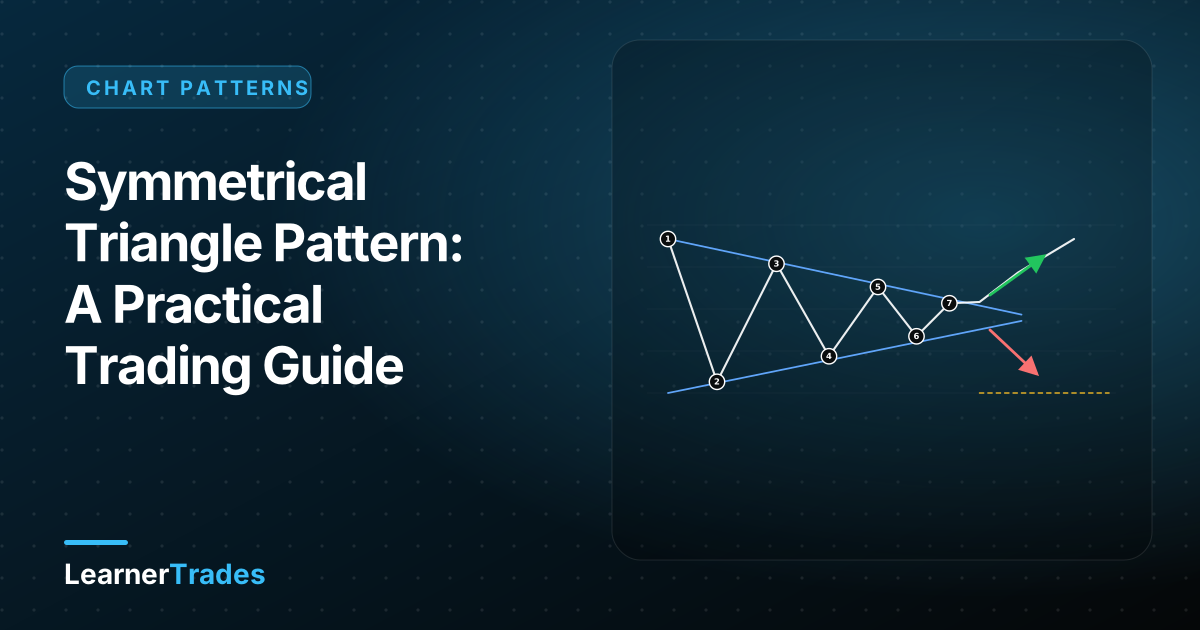
A symmetrical triangle squeezes price toward an apex before a breakout. Learn how to spot it, why direction is uncertain, and how to trade the break without guessing.
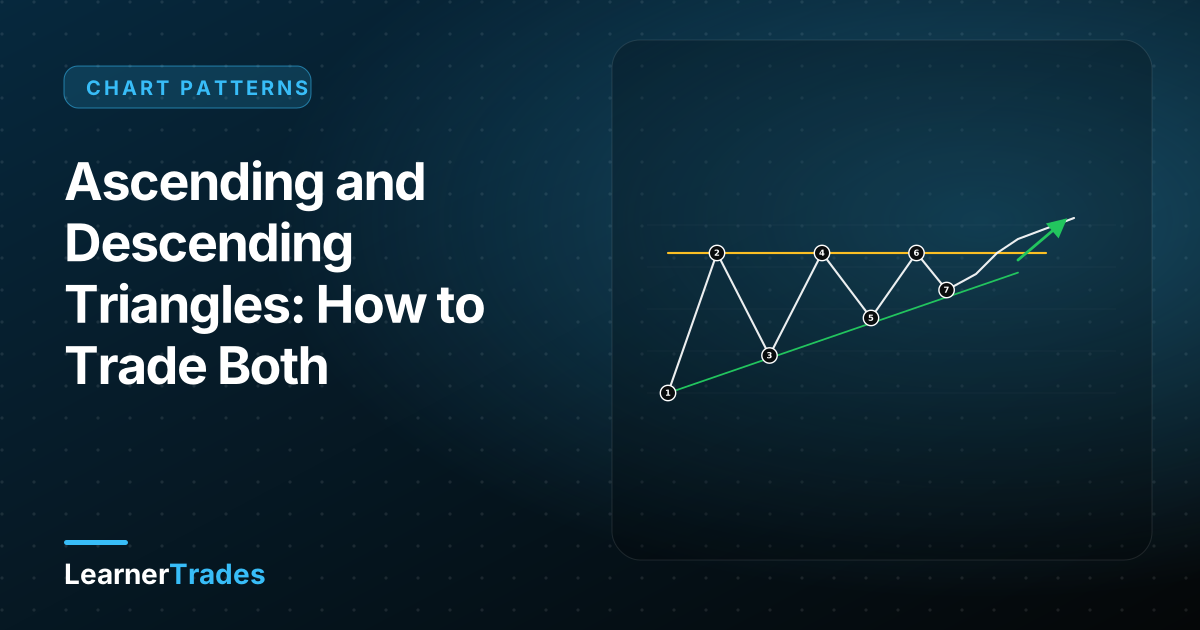
Ascending triangles lean bullish and descending triangles lean bearish. Learn the structure behind each, how to confirm the breakout and how to manage the trade.
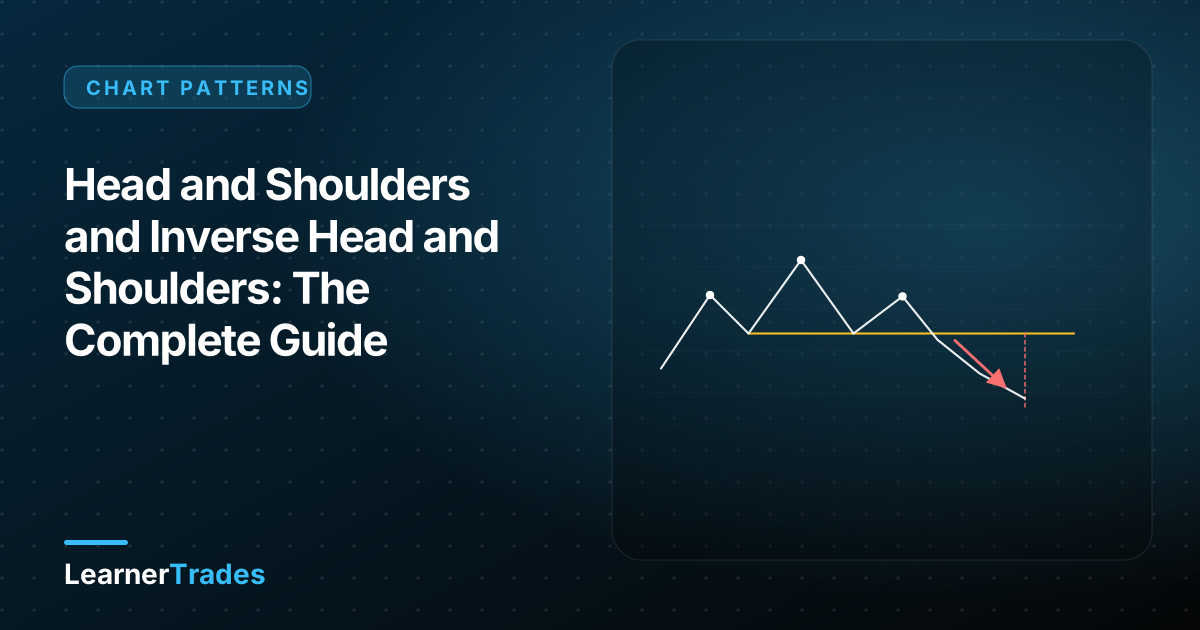
The head and shoulders is the most famous reversal pattern. Learn its anatomy, how the neckline works, how to enter, where to put the stop and how to project the target.
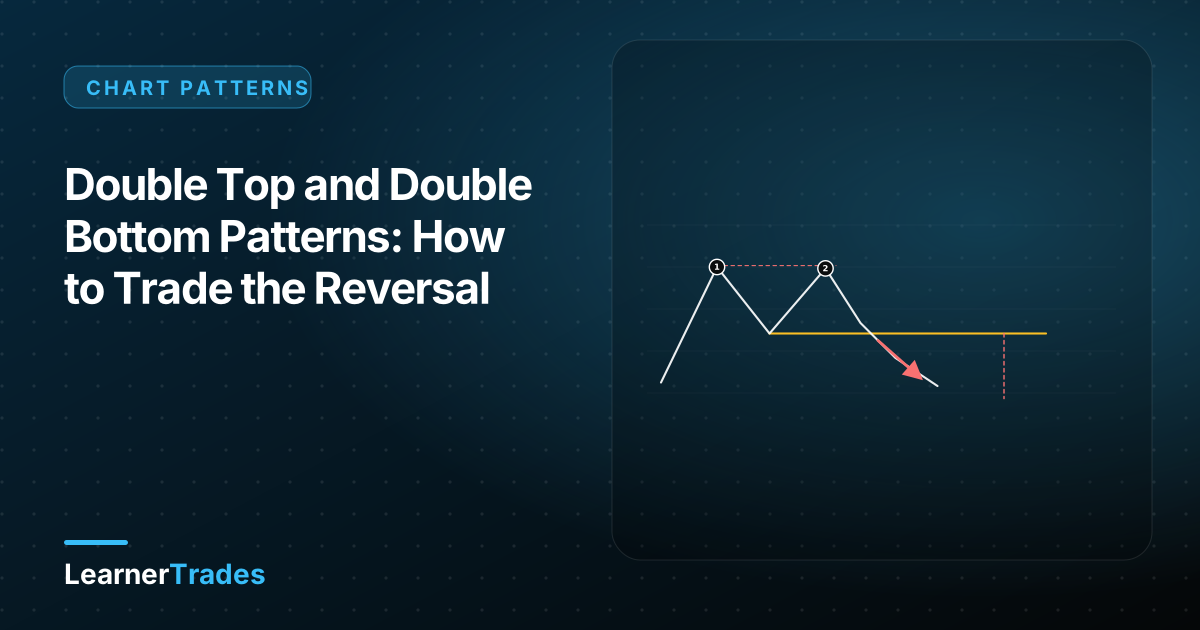
Double tops and bottoms show a market failing twice at the same level. Learn how to recognise them, wait for the neckline break and plan stops and targets.
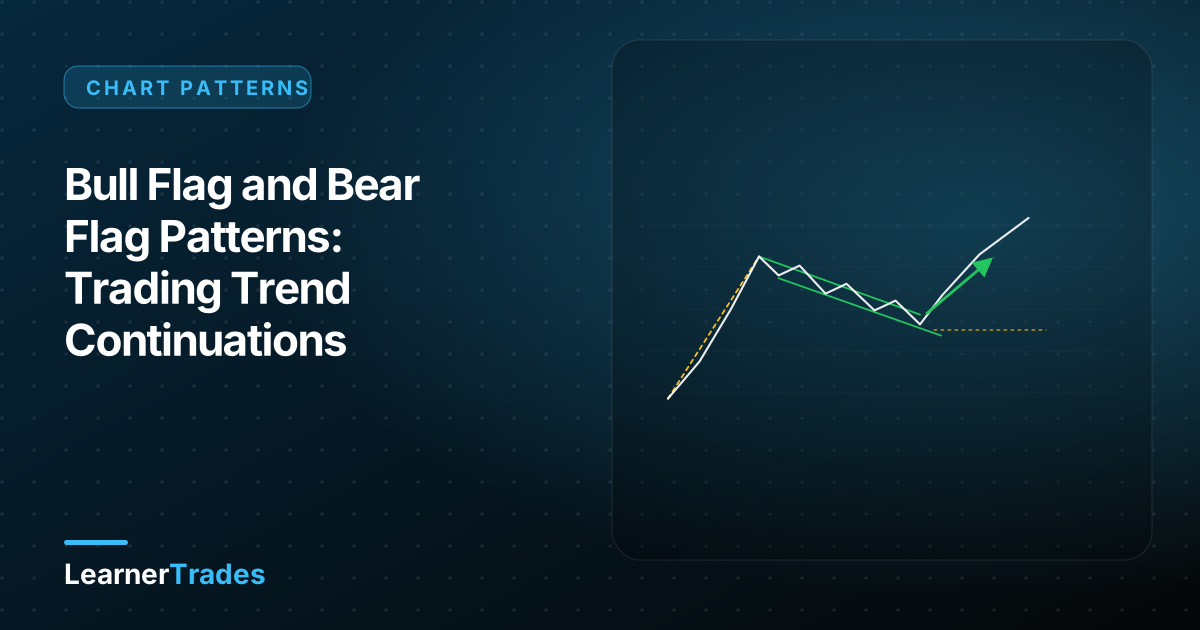
Flags are among the most common continuation patterns. Learn the pole-and-flag structure, how to enter the breakout, where to place stops and how to project targets.
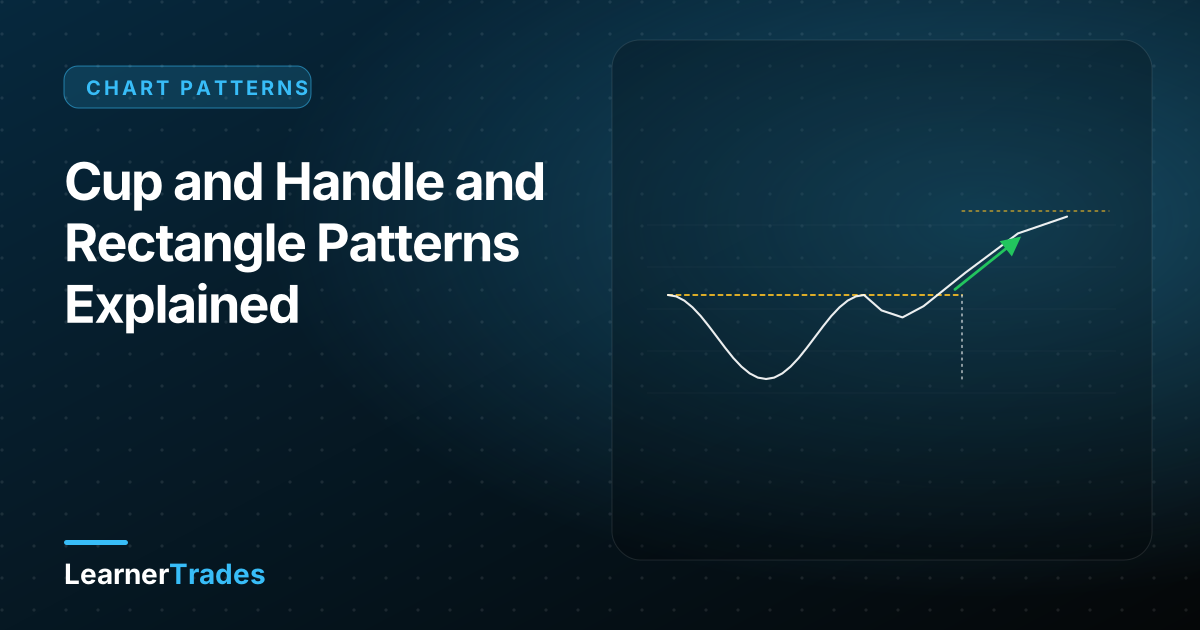
The cup and handle is a classic bullish continuation, and the rectangle is the simplest range pattern. Learn how to recognise both, trade the breakout and manage risk.
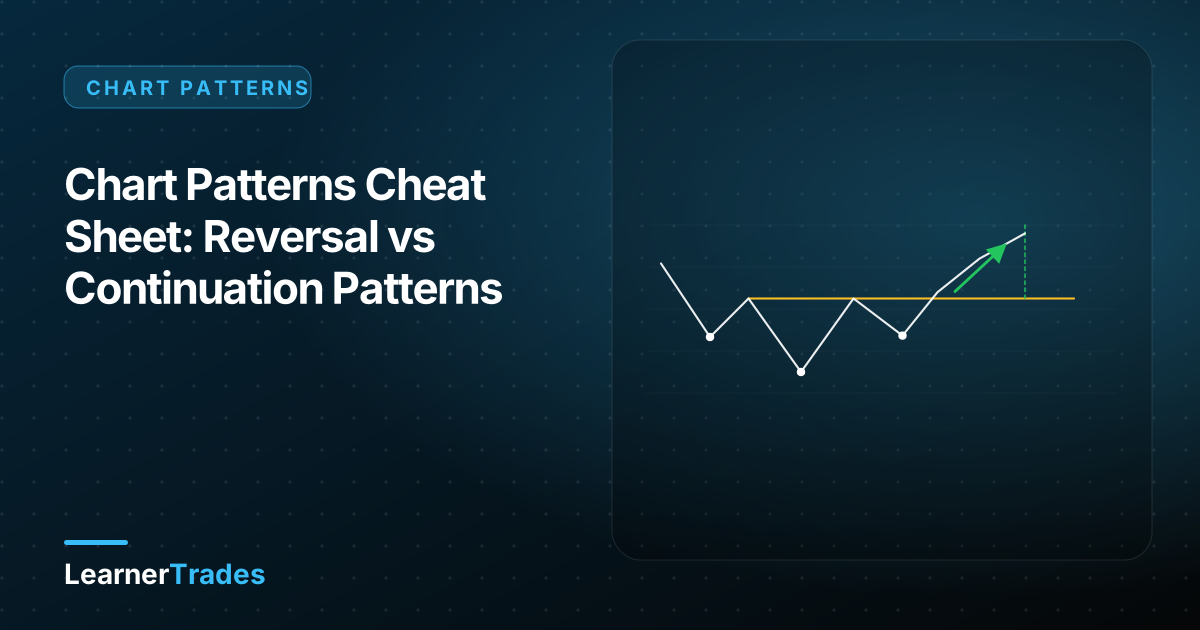
A one-page guide to the major chart patterns: which ones signal reversals, which continue the trend, what each looks like, and how to trade them with the same disciplined process.