A rising wedge is one of the most misread patterns on a chart. Price is climbing, higher highs and higher lows, so it looks healthy. But the climb is losing strength, and that is exactly what the pattern shows.
What a rising wedge is
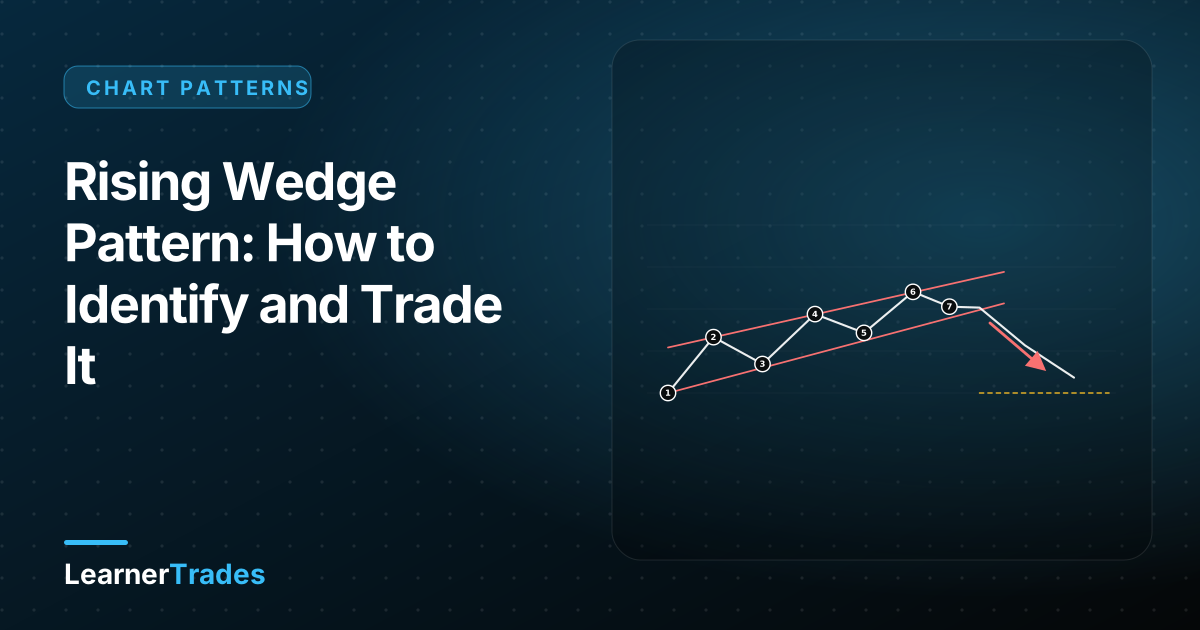
Two trendlines both slope upward, but the lower line rises faster than the upper one, so they converge. Each new high gains less than the last. Buyers are still in control, but each push higher takes more effort for less reward.
How to identify it:
- Draw a trendline through at least two rising lows and another through at least two rising highs.
- Check that the lines converge (the wedge narrows).
- Count at least five touches in total. More touches make the pattern more reliable.
- Note that range and momentum are shrinking from left to right.
Why it usually breaks down
In a rising wedge, buyers are paying higher prices for smaller gains. Sellers are absorbing the buying at each high. When buyers run out, price falls through the lower trendline, often quickly, because everyone who bought near the top is now underwater.
How to trade it
Entry. Wait for a candle to close below the lower trendline. Entering before the break is a guess, and wedges can keep grinding up for longer than expected.
Confirmation (optional but useful):
- Bearish divergence: price makes a higher high while RSI or MACD makes a lower high.
- Volume that fades during the wedge and expands on the break.
- A failed retest: price comes back to the broken line and is rejected.
Stop-loss. Place it above the most recent swing high inside the wedge, or above the upper trendline if you want a wider, safer stop. Size the position from that distance, see risk management and position sizing.
Target. The typical measured target is the start of the wedge, the low where the pattern began. Many traders take partial profit at the first support and move the stop to breakeven.
Common mistakes
- Trading it as bullish because price is making higher highs.
- Entering before the breakdown closes. Intrabar wicks through the line often reverse.
- Using a stop that is too tight, inside normal noise.
- Forcing the pattern. If the lines do not converge clearly, it is a channel, not a wedge.
Related guides
- Falling wedge pattern
- Chart patterns cheat sheet
- Head and shoulders pattern
- Risk management and position sizing
Frequently asked questions
Is a rising wedge bullish or bearish?
It is usually treated as bearish. Although price keeps making higher highs and higher lows, the narrowing range shows buying momentum fading. In a downtrend it can also appear as a bearish continuation pattern.
How do you confirm a rising wedge breakdown?
Wait for a candle to close below the lower trendline. Extra confirmation includes rising volume on the break, bearish divergence on RSI or MACD before the break, and a retest of the broken line that fails.
What is the usual target for a rising wedge?
A common target is the level where the wedge began (the lowest swing at the pattern start). Many traders scale out there or at intermediate support.