When price tests the same level twice and cannot get through, the market is telling you something about who is in control. That is the double top, and its upside-down twin is the double bottom.
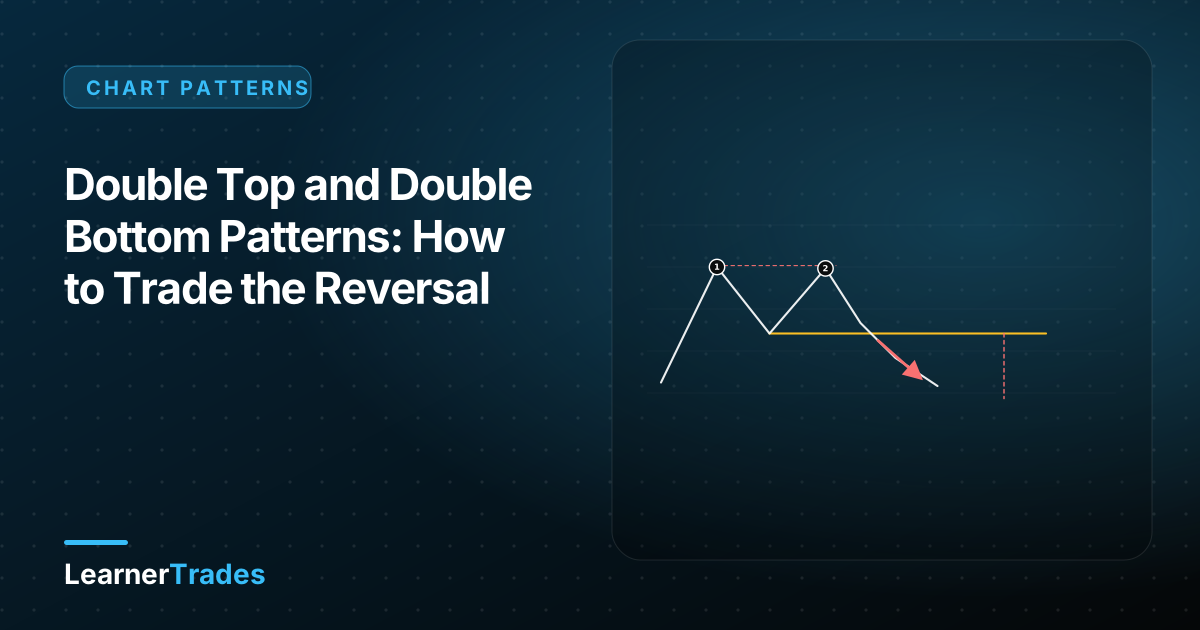
Double top (bearish reversal)
Structure:
- An uptrend reaches a high (top 1) and pulls back.
- Price rallies back to about the same level (top 2) and fails again.
- The low between the two peaks is the neckline.
- A close below the neckline confirms the pattern.
Trade plan:
- Entry: a close below the neckline, or a retest that fails.
- Stop: above the tops.
- Target: the distance from the tops to the neckline, projected down from the break.
Double bottom (bullish reversal)
Structure: a downtrend makes a low, bounces, returns to the same low and holds. The high between the two lows is the neckline; a close above it confirms the reversal.
Trade plan: enter on the close above the neckline (or a successful retest), place the stop below the two lows, and project the pattern height upward for the target.
Why they work (when they do)
Each failed attempt at the level shows that the dominant side is exhausted. Traders who entered near the tops or bottoms are trapped, and when price moves through the neckline their exits add to the momentum.
Checklist before taking the trade
- Was there a trend to reverse?
- Are the two extremes at a similar level and a sensible distance apart?
- Is there a closing break of the neckline, not just a wick?
- Is the risk-to-reward at least 1:2 after the stop?
Common mistakes
- Treating any two similar highs as a double top.
- Entering at the second top without confirmation.
- Ignoring that in a strong trend, a "double top" is often just a pause.
Related guides
- Head and shoulders pattern
- Chart patterns cheat sheet
- Support, resistance and liquidity
- Risk management and position sizing
Frequently asked questions
How far apart should the two tops be?
There is no fixed rule, but the two peaks should be at roughly the same level (within a small tolerance) and separated by a clear trough. Peaks that are only a few candles apart are usually just noise.
Is a triple top the same idea?
Yes. It is the same logic with three failed tests of a level; the neckline and target are measured in the same way.
Should I short at the second top?
Most traders wait for the neckline break. Shorting at the second top is a prediction; waiting for the break is a confirmation, and costs you some of the move but protects you from patterns that fail.