Support and resistance are the oldest ideas in technical analysis and still the most misunderstood. Retail charts are covered in horizontal lines that price ignores, while the levels that actually produce reactions are often not drawn at all. The difference comes from understanding why price reacts: because orders are resting there.
Levels are zones of orders, not lines
A level matters because participants placed orders around it — pending entries, take-profits, and above all, stop-losses. Those orders are not placed at a single price; they are spread across a band. So a level is a zone, typically spanning the wick extreme to the body of the candle that produced the reaction.
Three things make a zone strong:
- Aggressive departure. Price left the zone with large, fast candles. That means orders at the zone were large and unfilled.
- Freshness. A zone that has not been retested still holds most of its unfilled orders. Each test consumes some of them.
- Higher-timeframe origin. A daily zone outranks a 15-minute zone. When they overlap, probability rises sharply.
Ignore zones that produced a slow, choppy departure or that have been tested four or five times. They are exhausted.
Liquidity: the fuel of every move
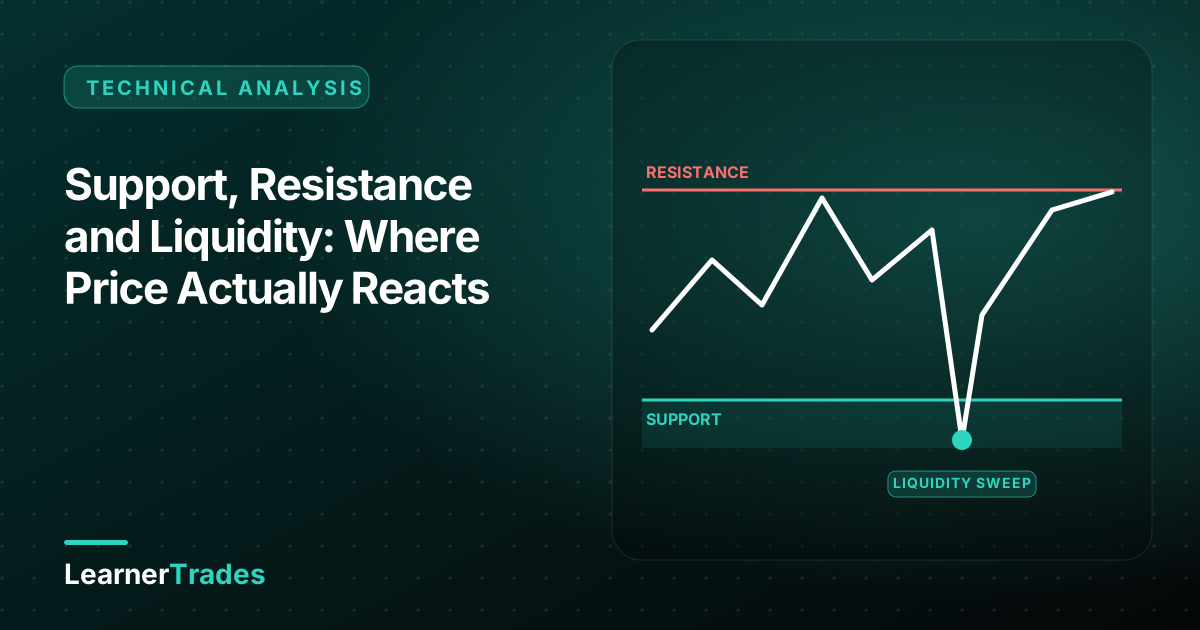
Large participants cannot fill a big order without the other side. The easiest place to find a large number of counter-orders is where retail stops are clustered: just above an obvious swing high or just below an obvious swing low. Equal highs, trendline touches and round numbers are magnets for the same reason.
So price is routinely pushed through an obvious level, stops are triggered (providing liquidity), and price then reverses. From the outside this looks like a "fake breakout". From the inside it is simply order filling. Once you see markets this way you stop placing stops in the obvious place and start using sweeps as entry triggers instead of being swept.
A liquidity sweep has a recognisable shape: a quick push beyond the level, a failure to close beyond it (on the timeframe you are reading), and a fast return inside the range, usually followed by a break of the opposite short-term structure.
Supply and demand
Supply and demand zones are a refinement of support and resistance. A demand zone is the base of consolidation just before a strong rally — the last place buyers accumulated. A supply zone is the consolidation just before a strong decline. We mark the zone from the base's low to its high (or to the open of the last bearish candle before the rally, for a tighter zone).
Entry at a fresh demand zone in an uptrend, with a stop just below it, is one of the highest reward-to-risk setups available because the stop is naturally tight and the target is the next supply zone or the prior high.
Session and daily levels that institutions watch
Beyond swing-based zones, several reference levels reliably attract reactions:
- Previous day high / low and previous week high / low. Classic liquidity targets.
- Asian session range. London often sweeps one side of it before the real move.
- Daily open and weekly open. Price above the open is bullish for the session; large players defend or attack them.
- Round numbers (1.1000, 2,000 on gold, 60,000 on BTC) where option strikes and stops cluster.
We mark these every day before publishing signals. A swing zone that coincides with the previous day's low and a round number is far more likely to hold than any one of them alone.
Confluence checklist
Before we accept a level for a signal, we ask:
- Is there a higher-timeframe zone here?
- Did price leave this zone aggressively, and is it still fresh?
- Is there obvious liquidity just beyond it that could be swept first?
- Does it align with a session or daily level?
- Does the structure on the entry timeframe agree with the higher-timeframe bias?
Three or more "yes" answers is a candidate. Fewer than three is a pass.
Common mistakes
- Drawing lines through candle bodies on every bounce. Draw fewer, better zones.
- Entering on the first touch of a level in a strong trend against you. Trend beats level.
- Placing stops exactly at the zone edge. Give it room beyond the wick extreme — that is where sweeps happen.
- Treating a break as confirmed on a wick. Wait for the close.
Related guides
- Market structure explained
- Chart patterns cheat sheet
- How to read candlestick charts
- How to write a trade plan
Frequently asked questions
How do I draw support and resistance correctly?
Draw zones, not lines. Mark the area between the wick extreme and the candle body of the swing that caused a strong move away. The more aggressive the departure and the fewer times the zone has been tested, the more significant it is.
What is liquidity in forex trading?
Liquidity refers to clusters of resting orders, most often stop-losses just above obvious highs and below obvious lows. Price is frequently driven into those clusters so large participants can fill orders, which is why breakouts often reverse.
Why does price reverse right after breaking a level?
Because the break triggered stop orders and breakout entries that provided the liquidity institutions needed to enter in the opposite direction. A break that fails to hold on a candle close and quickly returns inside the range is a classic liquidity sweep.