Gold (XAU/USD) is the most popular non-currency market for retail traders, and one of the most misunderstood. It is not just "a safe haven". Its price is the output of a handful of identifiable forces. Learn them and gold stops looking random.
The four forces behind gold
1. The US dollar
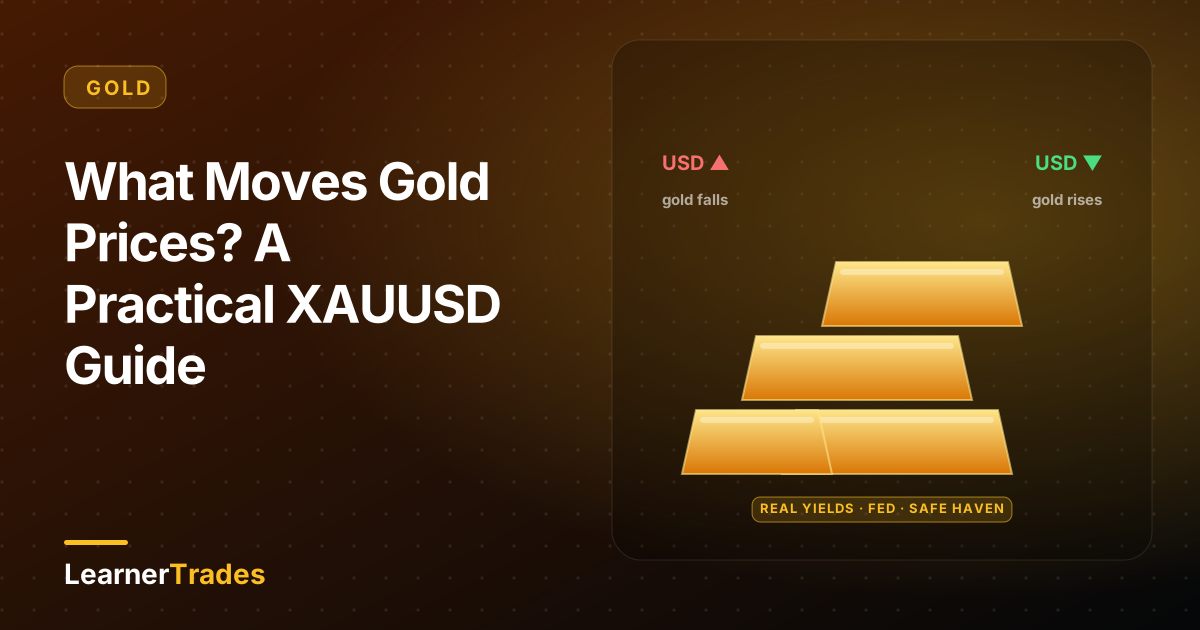
Gold is quoted in dollars, so the two usually move in opposite directions. A stronger dollar makes gold more expensive for everyone else and tends to weigh on it; a weaker dollar tends to support it. The DXY (dollar index) is the quickest gauge.
2. Real yields and Federal Reserve expectations
Gold pays nothing, so the competition is the return on safe bonds. When real yields (bond yields minus inflation) rise, holding gold costs more in forgone income and prices often fall. When the market expects rate cuts, real yields drop and gold usually benefits. This is why Fed meetings, CPI and jobs data move gold so violently.
3. Safe-haven demand
Geopolitical shocks, banking stress or equity sell-offs can push investors into gold as a store of value. These spikes can be fast, and they often fade once the fear subsides.
4. Central-bank and physical demand
Official-sector buying and jewellery and investment demand shape the longer-term trend rather than day-to-day moves. They help explain why gold can hold up even when short-term drivers look unfavourable.
When gold moves most
- London session and the London-New York overlap carry the most liquidity.
- US data releases (CPI, non-farm payrolls, Fed decisions) can produce moves of many dollars in minutes.
- Asian hours are typically calmer and more range-bound, but headlines can still cause gaps.
How to trade gold without blowing up
Gold's daily range is far larger than a typical forex pair's, so the usual rules need adjusting:
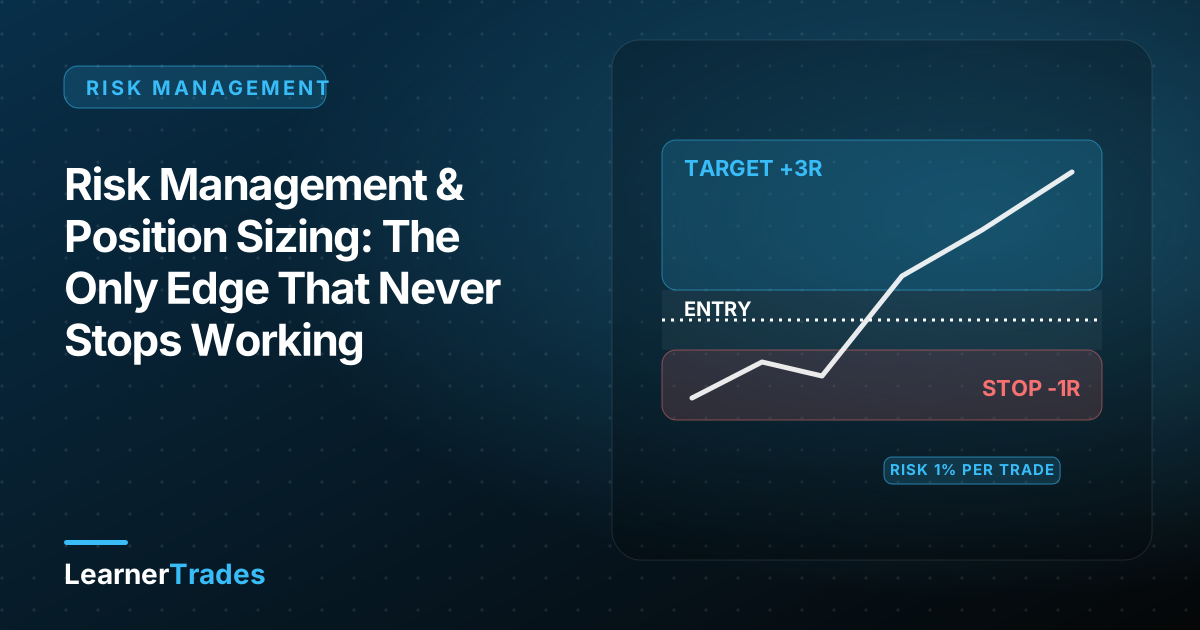
- Size from the stop, not the other way around. Decide where the idea is wrong, then set the position so that loss is a small fixed percentage of your account.
- Use ATR to place stops. A stop tighter than one Average True Range on your timeframe is inside normal noise.
- Reduce risk per trade. Many traders use 0.5-1% on gold instead of 1-2%.
- Respect event risk. Either be flat into major releases or accept a wider stop and a smaller size.
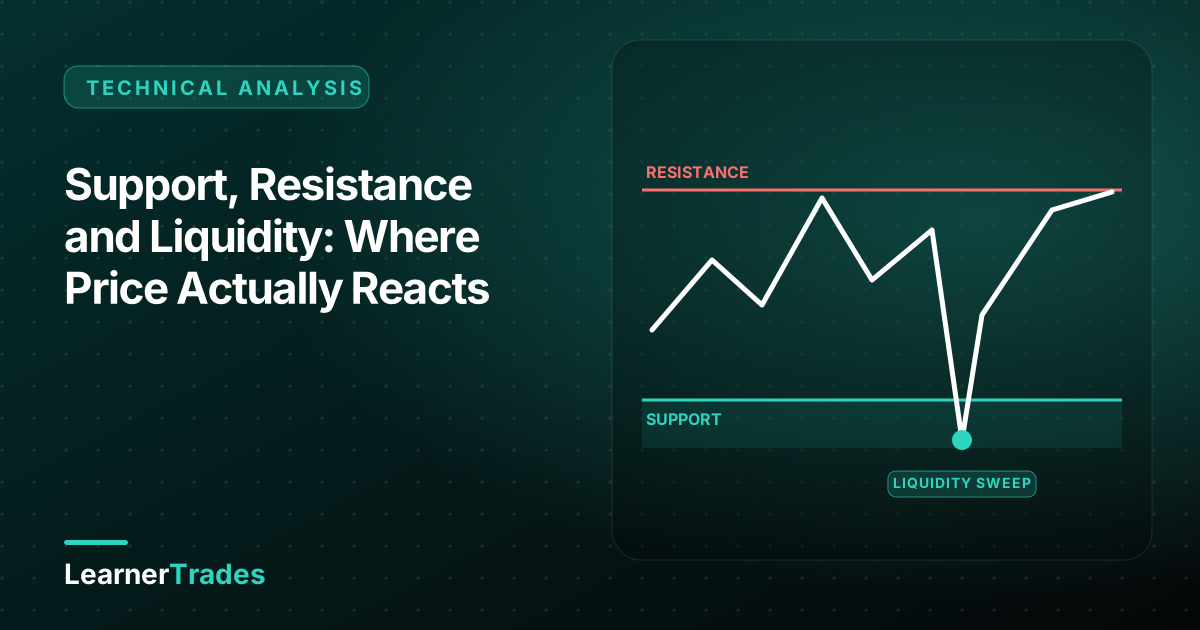
- Trade structure. Support, resistance and liquidity levels matter as much on gold as anywhere else; see our guide to support, resistance and liquidity.
Related guides
- Trading gold and crypto volatility
- Trading CPI, NFP and Fed decisions
- Forex sessions and best times to trade
- Risk management and position sizing
- Gold (XAU/USD): live price, drivers and trade ideas
Sources and further reading
These are independent official or research sources. Learner Trades is not affiliated with them.
Frequently asked questions
Why does gold go up when the dollar falls?
Gold is priced in US dollars. When the dollar weakens, gold becomes cheaper for holders of other currencies, which tends to lift demand and the dollar price of gold.
Do rising interest rates hurt gold?
Often, yes. Gold pays no yield, so higher real (inflation-adjusted) interest rates raise the opportunity cost of holding it. The effect is strongest when real yields rise unexpectedly.
What is the best time to trade gold?
The London session and the London-New York overlap offer the most liquidity. Many traders avoid holding positions through major US releases like CPI and non-farm payrolls.