
The forex market rotates around the globe: Sydney hands off to Tokyo, Tokyo to London, London to New York. Each session has a distinct personality — who is trading, how much volume there is, and how price tends to behave. Trading a London-style breakout strategy during the Tokyo lull is a reliable way to collect losses. Here is how we use sessions when planning daily signals.
The four sessions (UTC)
| Session | Approx. hours (UTC) | Character |
|---|---|---|
| Sydney | 21:00–06:00 | Thin, slow, mostly AUD/NZD flow |
| Tokyo | 00:00–09:00 | Range-building; JPY pairs most active |
| London | 07:00–16:00 | Highest volume; trends start here |
| New York | 12:00–21:00 | Volatile first half, fades after London close |
Note that these shift by an hour with daylight-saving changes in the UK and US; always check the current offset.
The Asian session: the range
Tokyo typically builds a consolidation. Volume is modest and the major pairs (EUR/USD, GBP/USD) often move 20–40 pips in a sideways band. This range matters because its high and low become liquidity targets for London. We mark the Asian high and low every day.
JPY pairs (USD/JPY, EUR/JPY, GBP/JPY) and AUD/NZD pairs are the exception — they can trend during Tokyo, especially around Bank of Japan commentary or Australian data at 00:30 UTC.
The London open: the sweep and the move
London is where the day's directional move usually begins. A recurring pattern:
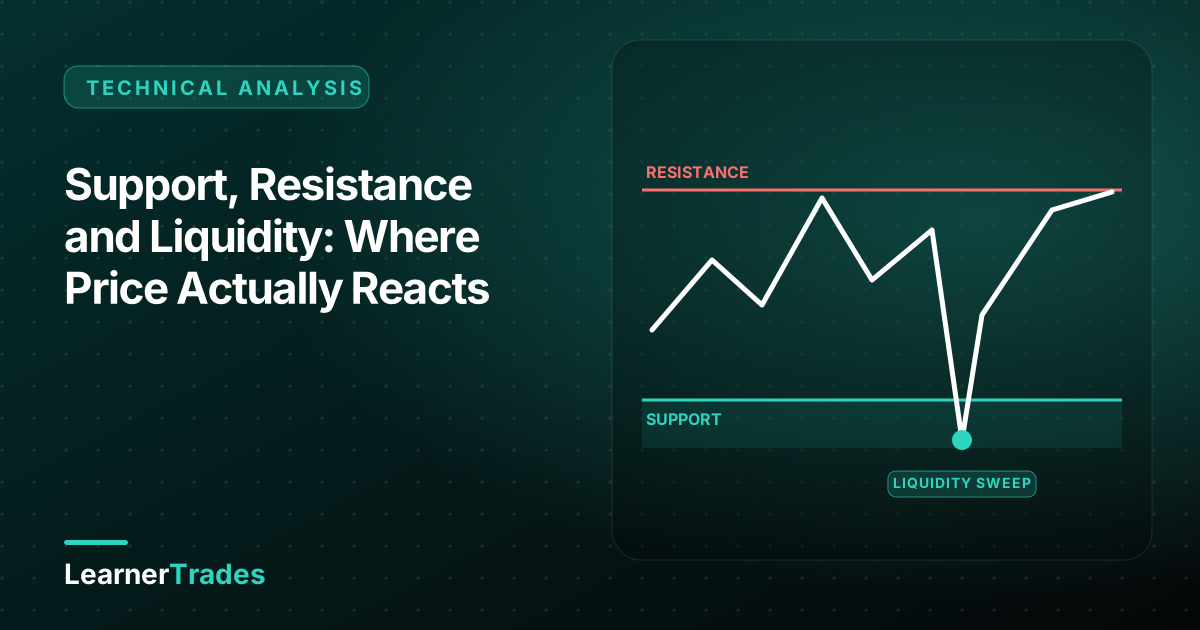
- Shortly after 07:00 UTC, price pushes through one side of the Asian range.
- Stops above/below the range are triggered (liquidity collected).
- Price fails to hold beyond the range on a 15-minute close and returns inside.
- The real move develops in the opposite direction, often running for several hours.
The sweep-and-reclaim at the London open is one of our highest-frequency signal setups on EUR/USD and GBP/USD. The stop goes beyond the sweep wick; the first target is the opposite side of the Asian range.
Not every day follows this script — on strong trend days London simply continues the prior direction. The higher-timeframe bias tells you which to expect.
The London–New York overlap: maximum liquidity
From roughly 12:00 to 16:00 UTC both centres are active. This is the deepest, most liquid part of the day, the window where most US data is released (12:30 UTC and 14:00 UTC are the key times), and where the largest moves on EUR/USD, GBP/USD, USD/CAD and gold occur.
Two useful behaviours:
- Continuation: if London established a clear trend, New York often extends it into the overlap, then reverses or stalls after London closes at 16:00 UTC.
- New York reversal: when the London move has run far and the US open hits a major level, a reversal of the entire London move is common. The 13:30–14:30 UTC window is notorious for this.
After London closes
From 16:00 UTC volume thins steadily. Moves become choppy and spreads widen into the US close. We rarely publish new intraday forex signals after 17:00 UTC; swing signals on higher timeframes are unaffected.
Which pairs, when
- EUR/USD, GBP/USD, USD/CHF: London open and overlap.
- USD/JPY, EUR/JPY, GBP/JPY: Tokyo for range trades, London for breakouts, overlap for momentum.
- AUD/USD, NZD/USD: Sydney/Tokyo for data-driven moves, London for continuation.
- USD/CAD: New York, especially around Canadian data and oil moves.
- XAU/USD (gold): London open and the New York overlap, plus every US data release.
News and the economic calendar
High-impact scheduled events — Non-Farm Payrolls (first Friday, 12:30 UTC), CPI, FOMC/ECB/BoE decisions — produce violent two-way moves in the first minutes, with widened spreads and slippage. Our approach: no new entries 30 minutes before a release, let the first candle complete, then trade the structure that forms after the spike. The post-news trend is usually cleaner than the spike itself.
A daily session routine
- Before Tokyo closes (06:30 UTC): mark the Asian high/low, the previous day's high/low, the weekly open and major higher-timeframe zones.
- London open (07:00–09:00): watch for the sweep-and-reclaim or a continuation break with a 15-minute close. Execute per the checklist.
- Pre-New York (12:00): review open positions; take partials before major data if the trade is already in profit.
- Overlap (12:00–16:00): manage, add continuation entries if structure allows.
- After 17:00: no new intraday risk. Journal and plan tomorrow.
Related guides
- Forex trading for beginners
- Trading gold and crypto volatility
- Trading CPI, NFP and Fed decisions
- What moves gold prices
- Live prices for the major pairs
Frequently asked questions
What is the best time to trade forex?
The London–New York overlap (roughly 12:00–16:00 UTC) has the highest liquidity and volatility for EUR/USD, GBP/USD and USD/CHF. The London open (07:00–09:00 UTC) is the other prime window. For JPY and AUD pairs, the Tokyo session adds a useful window.
What is the Asian range strategy?
Mark the high and low of the Asian session (roughly 00:00–07:00 UTC). London frequently sweeps one side of that range to collect liquidity before moving in the opposite direction. Traders wait for the sweep and a reclaim, then trade the reversal toward the other side.
Should I trade during news releases?
Spreads widen and slippage increases around high-impact releases such as NFP, CPI and central bank decisions. Most traders are better off flat for 15–30 minutes around the release and trading the post-news structure instead of the initial spike.