
We track every signal we publish, and one pattern is consistent: when members write in about a losing week, the signals that week were usually fine. The losses came from trades taken late, sized too big, closed too early or held too long. Trading psychology is not soft science; it is the direct cause of most of the gap between a system's expectancy and the trader's actual results.
The core problem: your brain is a bad trader
Human beings evolved to avoid losses, seek certainty and act on social proof. Markets punish all three. Specifically:
- Loss aversion makes a $100 loss feel about twice as painful as a $100 gain feels good — so we hold losers (to avoid making the loss "real") and cut winners (to lock in the good feeling). That is the exact opposite of profitable behaviour.
- Recency bias makes the last three trades feel like the truth about the system. After three losses we abandon a profitable approach; after three wins we double the size.
- The need to be right turns a trade into an identity. Being stopped out becomes a personal failure instead of a business expense.
You will not remove these instincts. You can only build a process that does not depend on overriding them in the moment.
The six execution killers
1. FOMO entries
Price starts moving before you enter, and you chase. Now your entry is worse, your stop is further (or you leave it where it was and the reward-to-risk collapses). Fix: the one-third rule — if price has already covered a third of the distance to TP1, the trade no longer exists for you.
2. Over-sizing after wins
"I'm on a roll." Variance does not know you are on a roll. Fix: size is a formula, not a feeling. Change your risk percentage only at a monthly review, never intra-week.
3. Widening the stop
Price approaches the stop and you move it "just a little" to avoid being taken out before the reversal. You have just converted a defined-risk trade into an undefined one. Fix: set the stop with the broker, not mentally, and treat moving it away as a rule violation that ends the session.
4. Cutting winners early
Price goes +0.8R, flinches, and you close to "protect profit". The trade then runs to +3R without you. Repeated over a year, this one habit can turn a +0.3R expectancy system negative. Fix: pre-defined partials. Take the first partial at TP1 and nowhere else; let the rules decide.
5. Revenge trading
After a loss, the next trade is bigger, faster and worse. Fix: structural stops — the platform closes after two consecutive losses or a 3% daily drawdown. No exceptions, no "one more".
6. Boredom trading
No valid setups appear, so you manufacture one. Fix: a required checklist (see our trade plan article). If the checklist is not complete, the order does not go in. Boredom is a signal to walk away, not to lower the bar.
Process beats willpower
Every fix above has the same shape: convert a decision made under emotion into a rule made in advance. The rule is written down, mechanical, and ideally enforced by the platform rather than by you. This is why professional desks have risk managers who can shut traders off — not because the traders are weak, but because everyone is weak at the moment of maximum pressure.
Practical tools:
- A written playbook with your two or three setups, their checklists and their management rules.
- Hard loss limits set in the broker where possible.
- Pre-session routine: mark levels, note news, write the plan, then trade. Never open the chart and "see what's happening".
- Post-session routine: journal plan adherence, close the platform, leave.
The R-multiple mindset
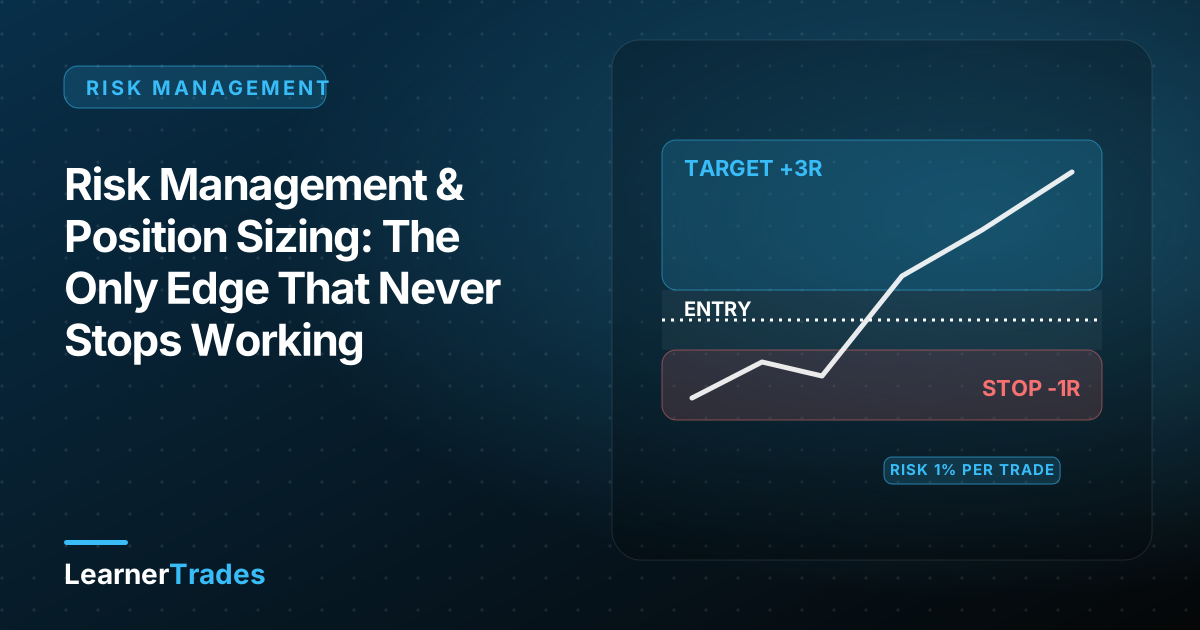
Measure every outcome in R — multiples of your initial risk — not in dollars. A −1R loss is the planned cost of doing business; a +2.5R win is a good trade. Thinking in R removes the emotional weight of currency and makes a $100 loss and a $1,000 loss feel like what they are: the same planned event at different account sizes. It also lets you compare performance across months as your account grows.
Sample size and patience
A system with positive expectancy can lose for twenty trades. If you judge it on the last five, you will abandon every good system you ever find. Commit to a minimum of 40–50 trades before evaluating a setup, with fixed risk, in a journal. The patience to collect a sample is itself an edge, because almost nobody has it.
When to walk away
Trading on days when you are tired, angry, ill or distracted is a negative-expectancy activity even with a positive-expectancy system. One honest question before each session — "Am I in a state to follow my rules?" — is worth more than most indicators.
Related guides
- 10 beginner trading mistakes
- Risk management and position sizing
- How to write a trade plan
- Forex trading for beginners
Frequently asked questions
Why do I lose money even with good signals?
Usually because of execution errors driven by emotion: entering late, over-sizing, moving stops, closing winners early or holding losers. The signal defines the plan; the trader has to follow it. A journal that records plan adherence usually reveals the problem within a few weeks.
How do I stop revenge trading?
Install a hard rule that ends the session after a defined loss (for example 3% of equity) or after two consecutive losses, close the platform physically, and schedule a review for the next day. Revenge trading cannot be out-willed in the moment; it has to be prevented structurally.
How many trades should I take per day?
Fewer than you think. Most profitable discretionary traders take one to three carefully selected trades per day, or a handful per week on swing timeframes. Trade frequency and profitability are inversely related for most retail traders.